

Trade Smarter

The TradeViz data visualization tool is a powerful, intuitive tool tailored to the analysis of stock data. TradeViz can easily be integrated with CSV or Excel files, making it a versatile tool for investors who want to analyze their own data.
Year 2023
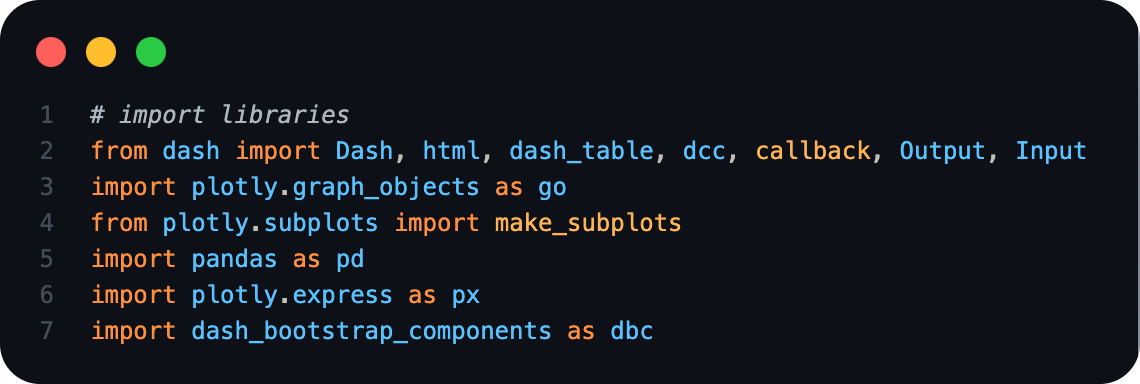
Languages Python, C++, C#, SQL
“ Visualize Your Trades ”
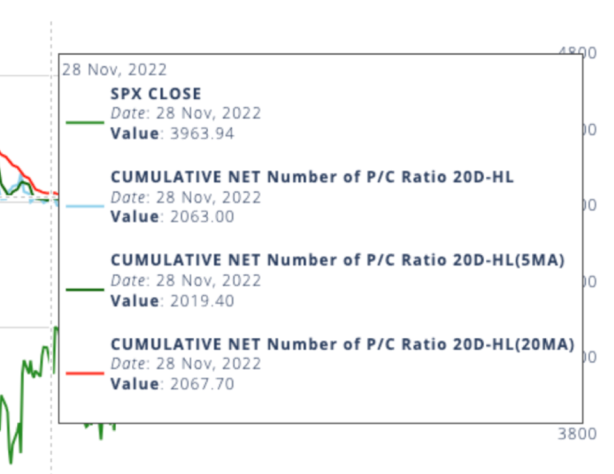
TradeViz is a powerful and intuitive data visualization tool tailored for stock data that enables investors to visualize their trades and make informed investment decisions. We also provide accurate labels of each data point and crosshair lines, similar to a professional trading view.
All at Your Fingertips.
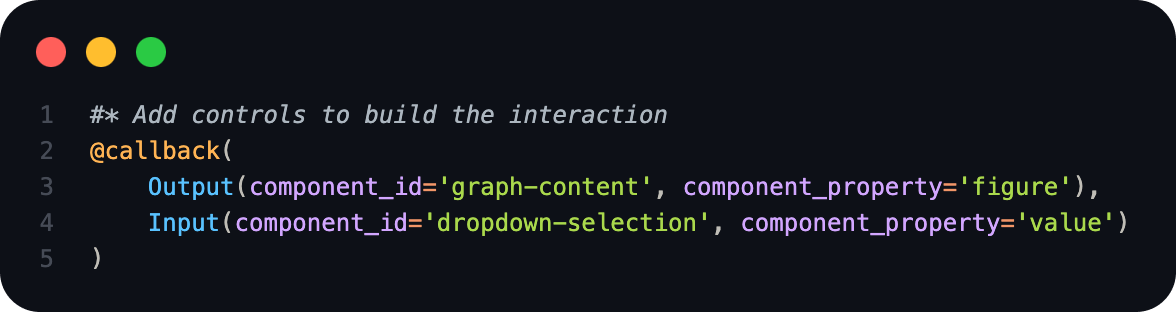
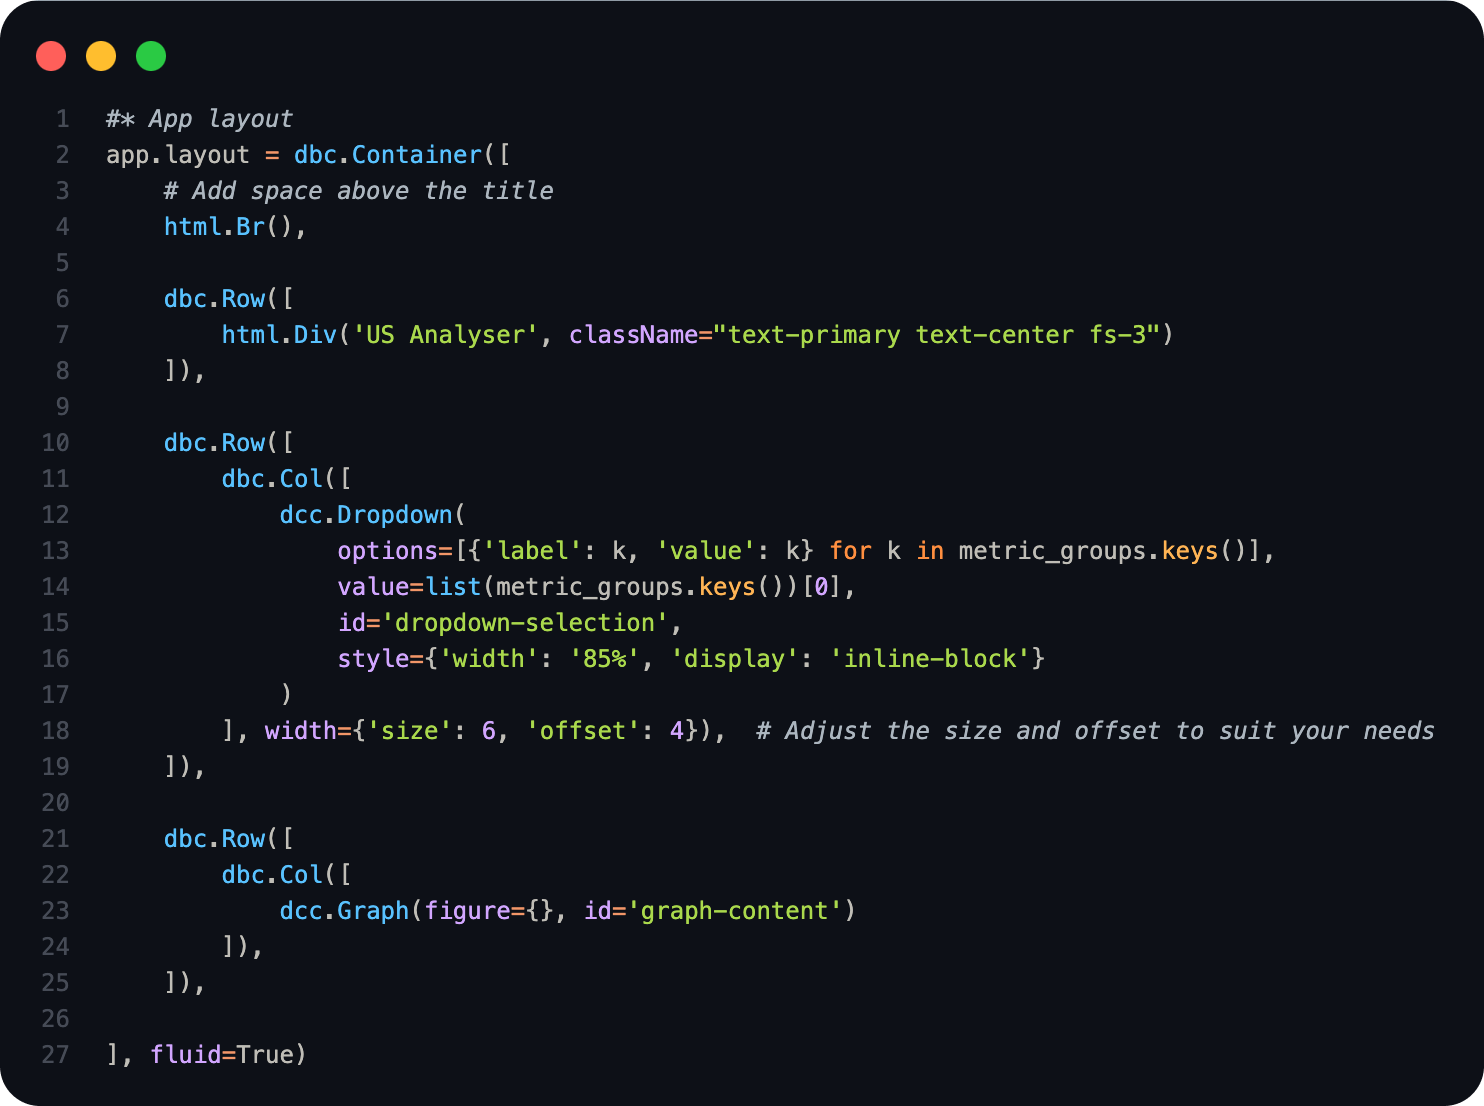
TradeViz is designed to help investors monitor and analyze stock data in a simple and intuitive way. User interfaces can be accessed in a variety of ways with the app's interactive features.
CSV, Excel file support

FRED, Futu, Yfinance
Interactive graphs
PNG download
Growing every day.
Real-time data visualization

Trading strategies
Backtest system
High-performance computing
Next project